We're excited to announce that we've undergone a complete website redesign to enhance your browsing experience! Our fresh new look is designed to make navigation easier and content more accessible. Click here to be taken to the new OSPO homepage. Should you have any questions please reach out to the OSPO Webmaster.
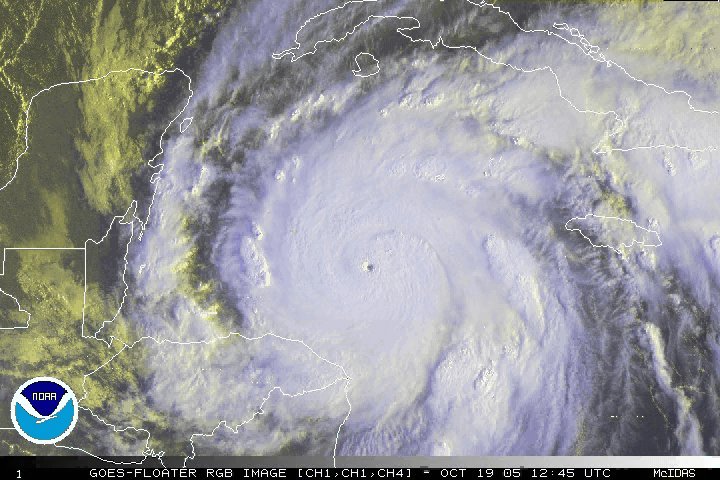
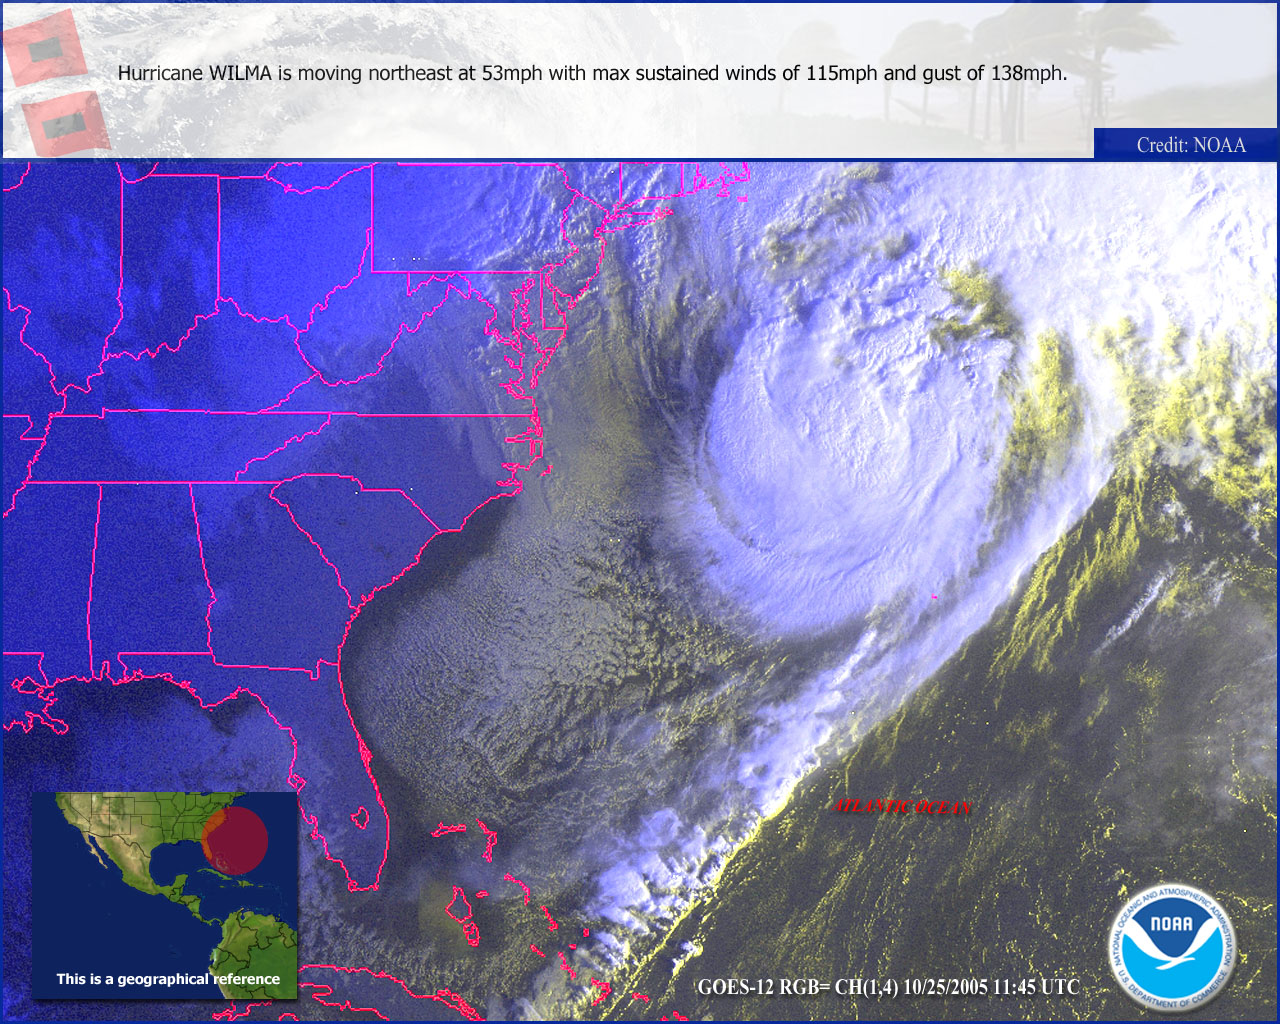
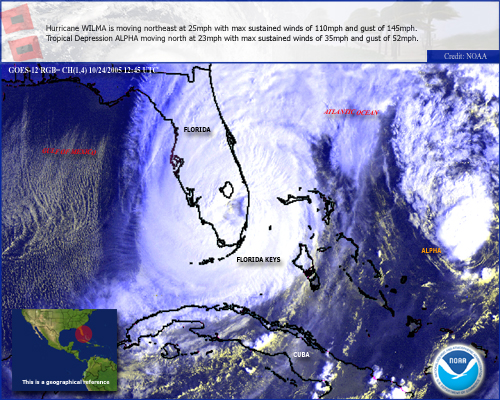
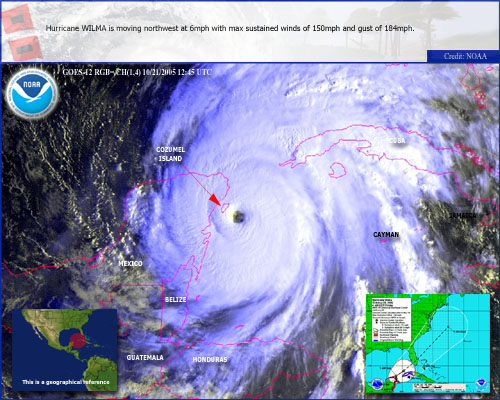
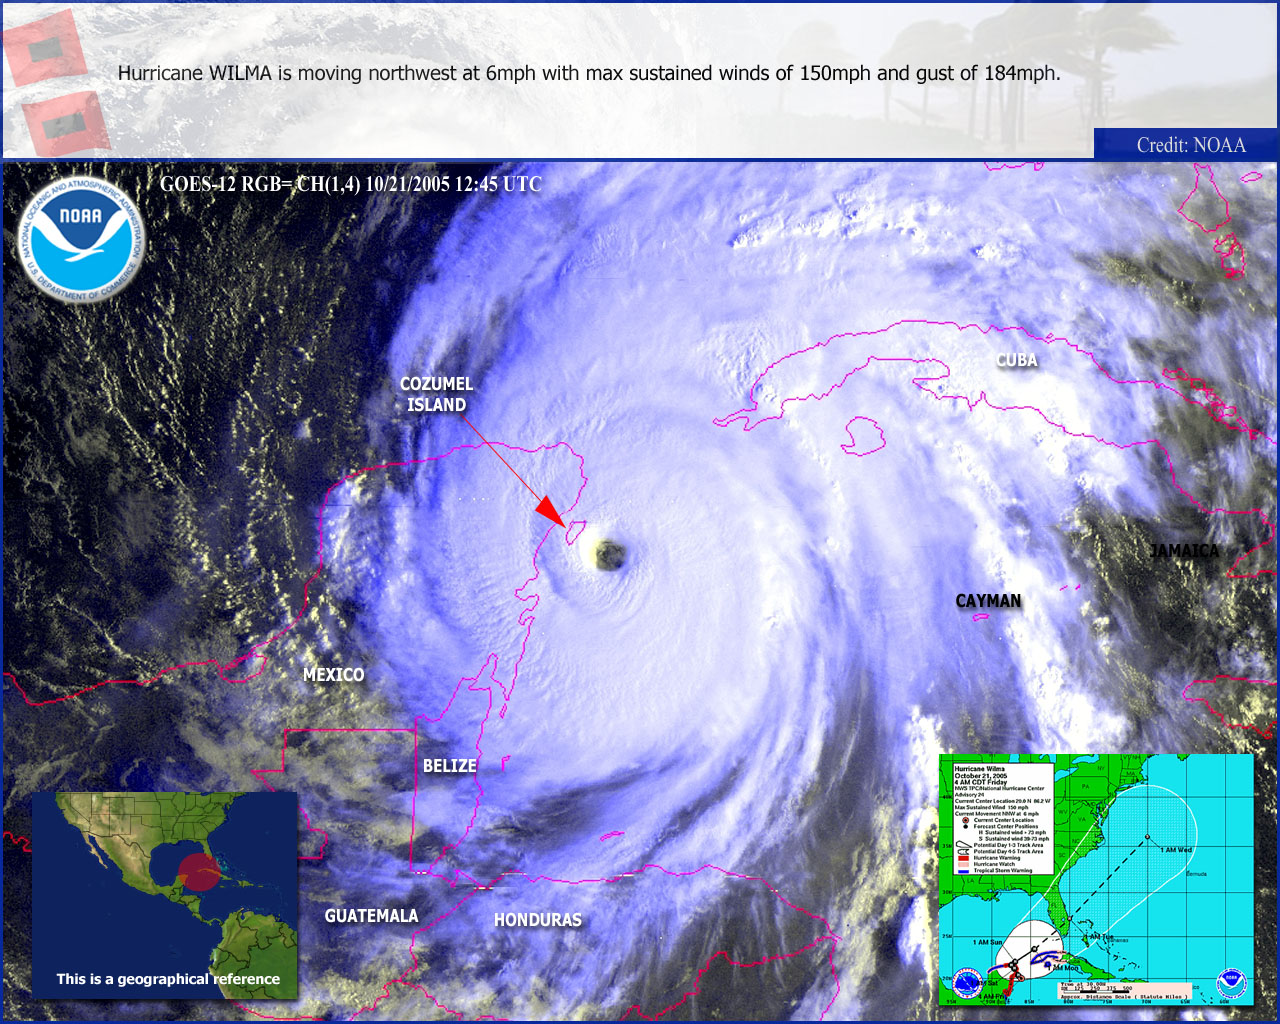
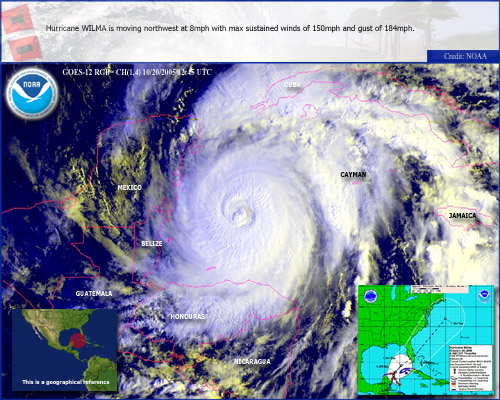
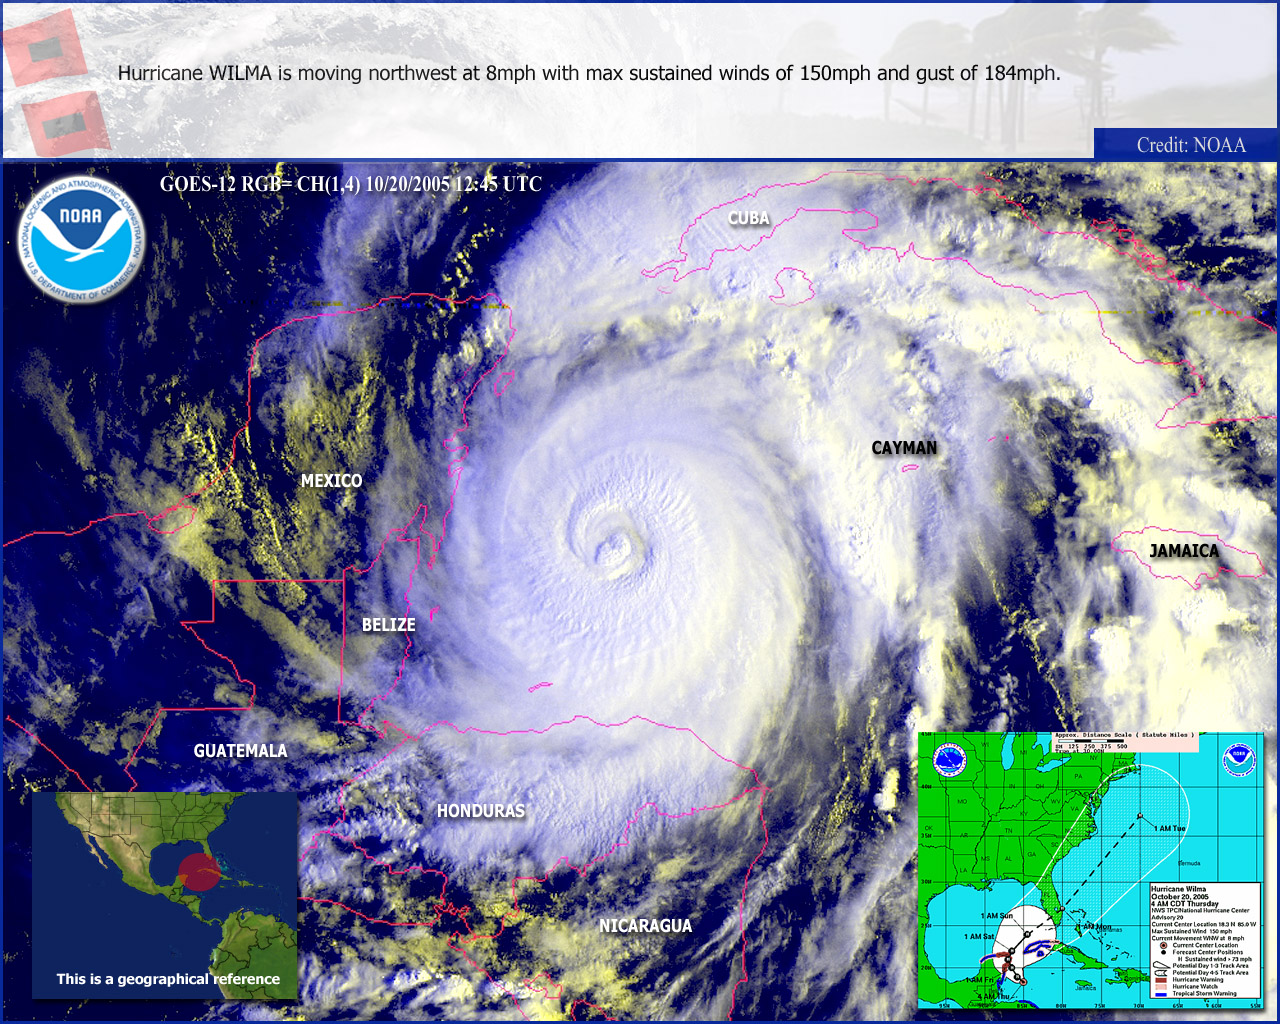
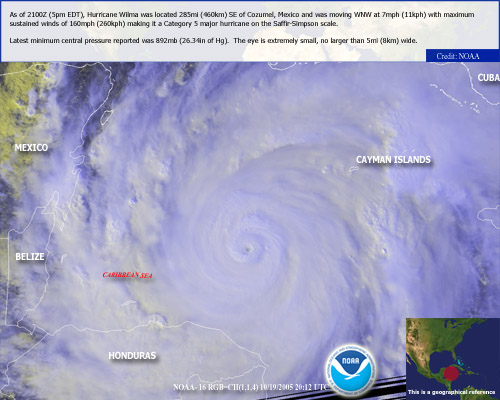
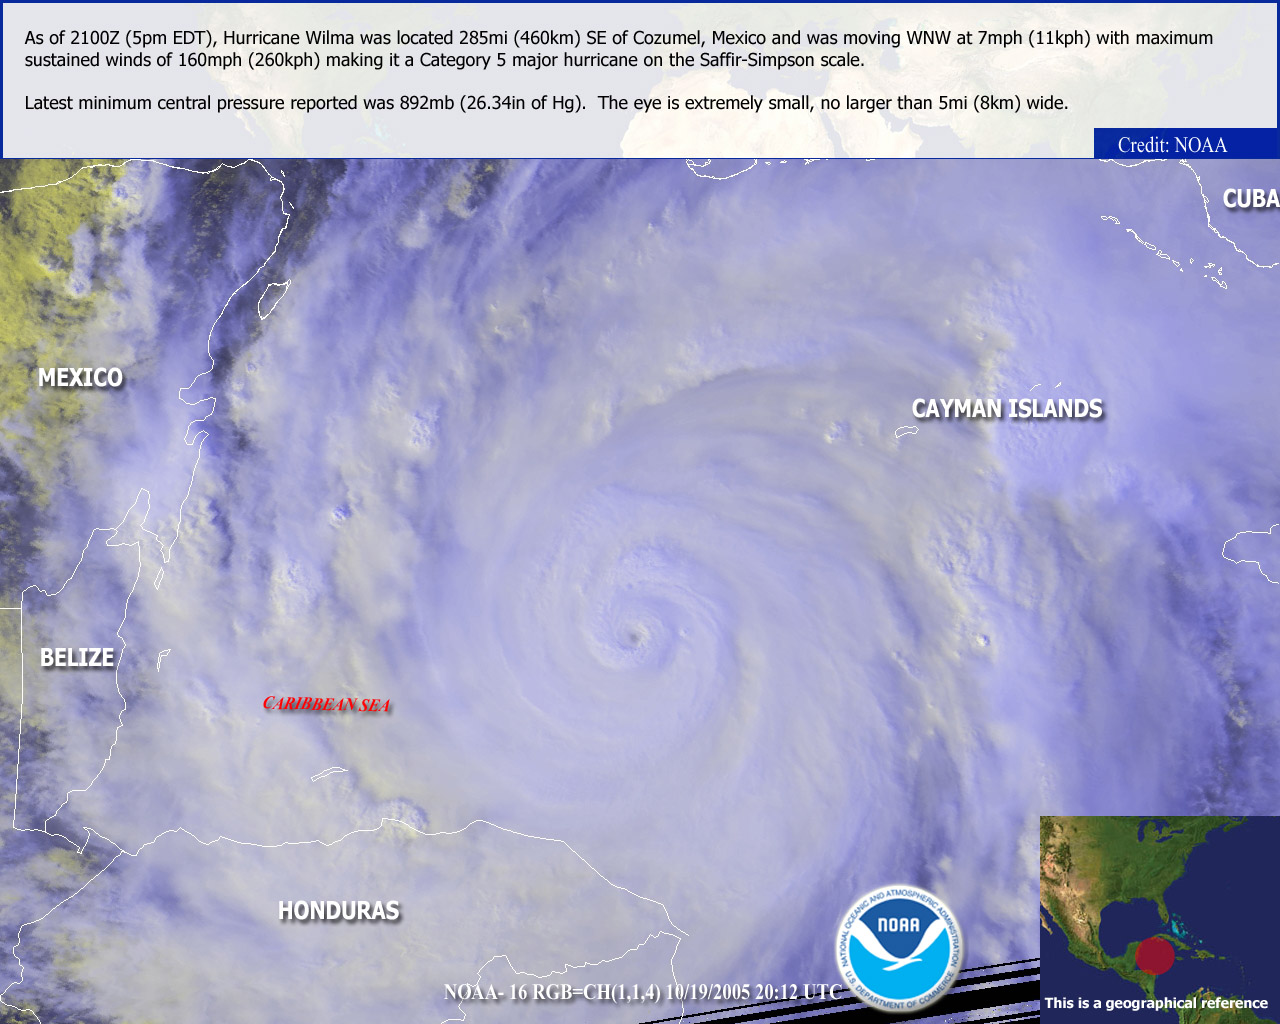
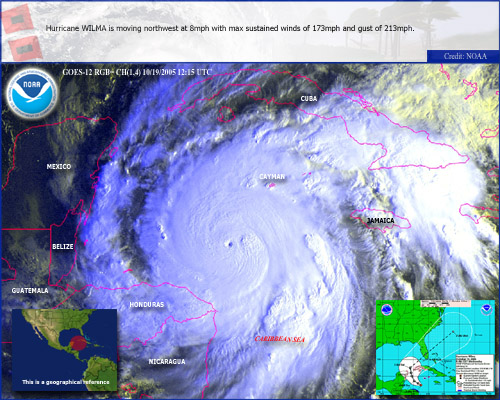
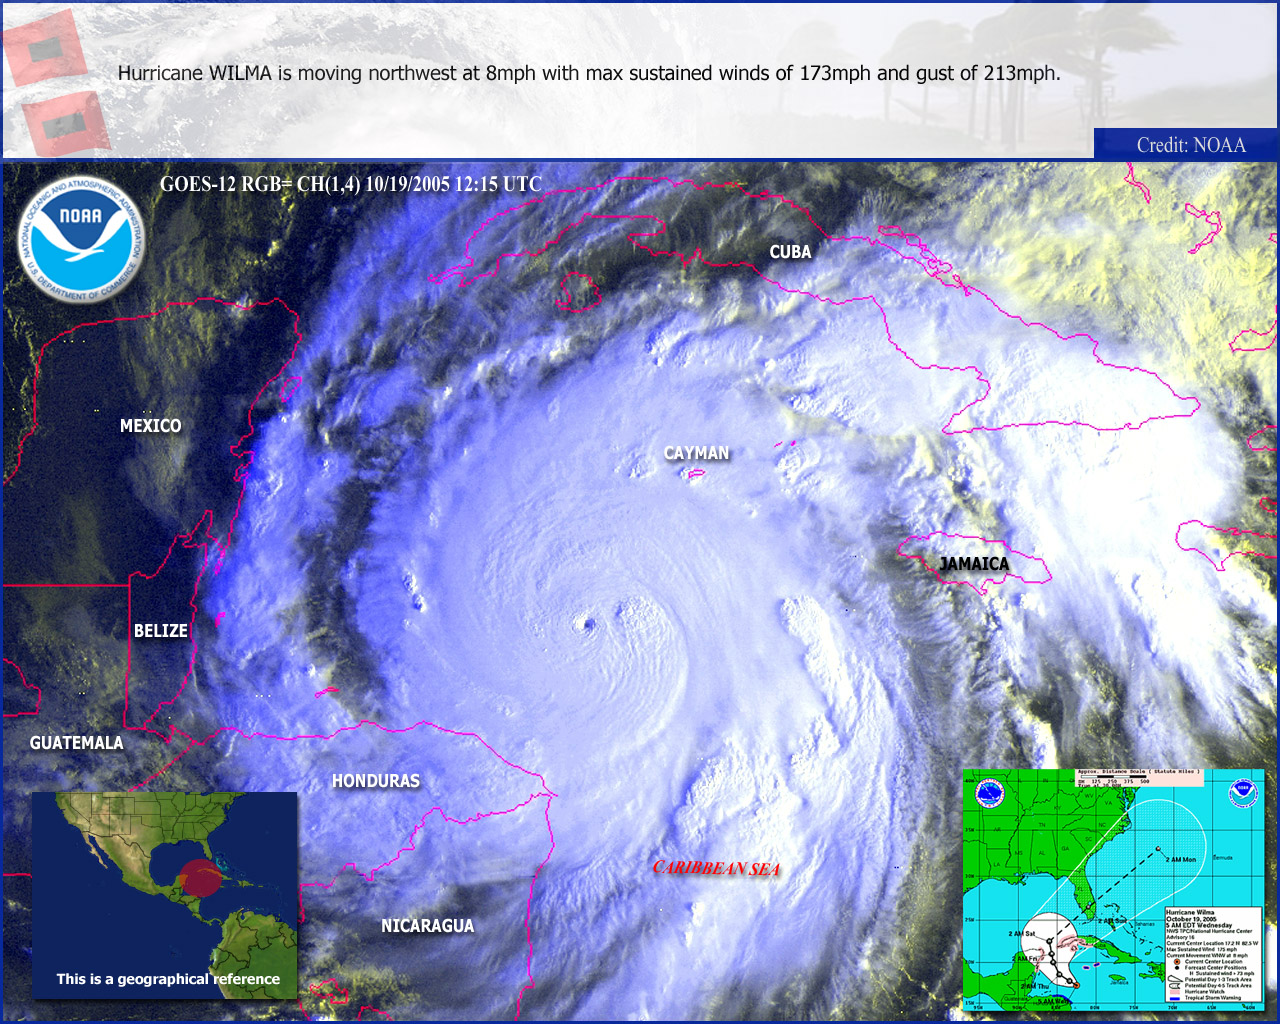
Images of Hurricane Wilma Hurricane Wilma, 12:45Z, October 19, 2005 – About 340 miles southeast of Cozumel, Mexico with maximum sustained winds are near 175 MPH. This makes Wilma a potentially catastrophic category five hurricane on the Saffir-Simpson scale. Dropsonde and flight-level data from an Air Force plane estimated the minimum central pressure to be 882 MB or 26.05 inches just edging out Hurricane Gilbert (estimated 882-885 Mb) for the lowest pressure on record for a hurricane in the Atlantic Basin.
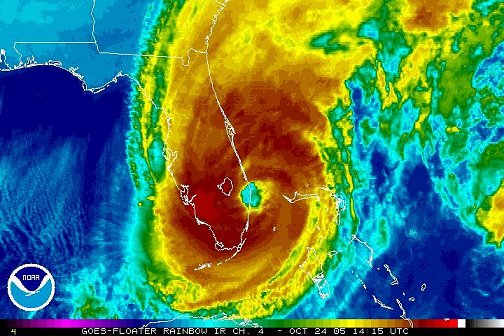
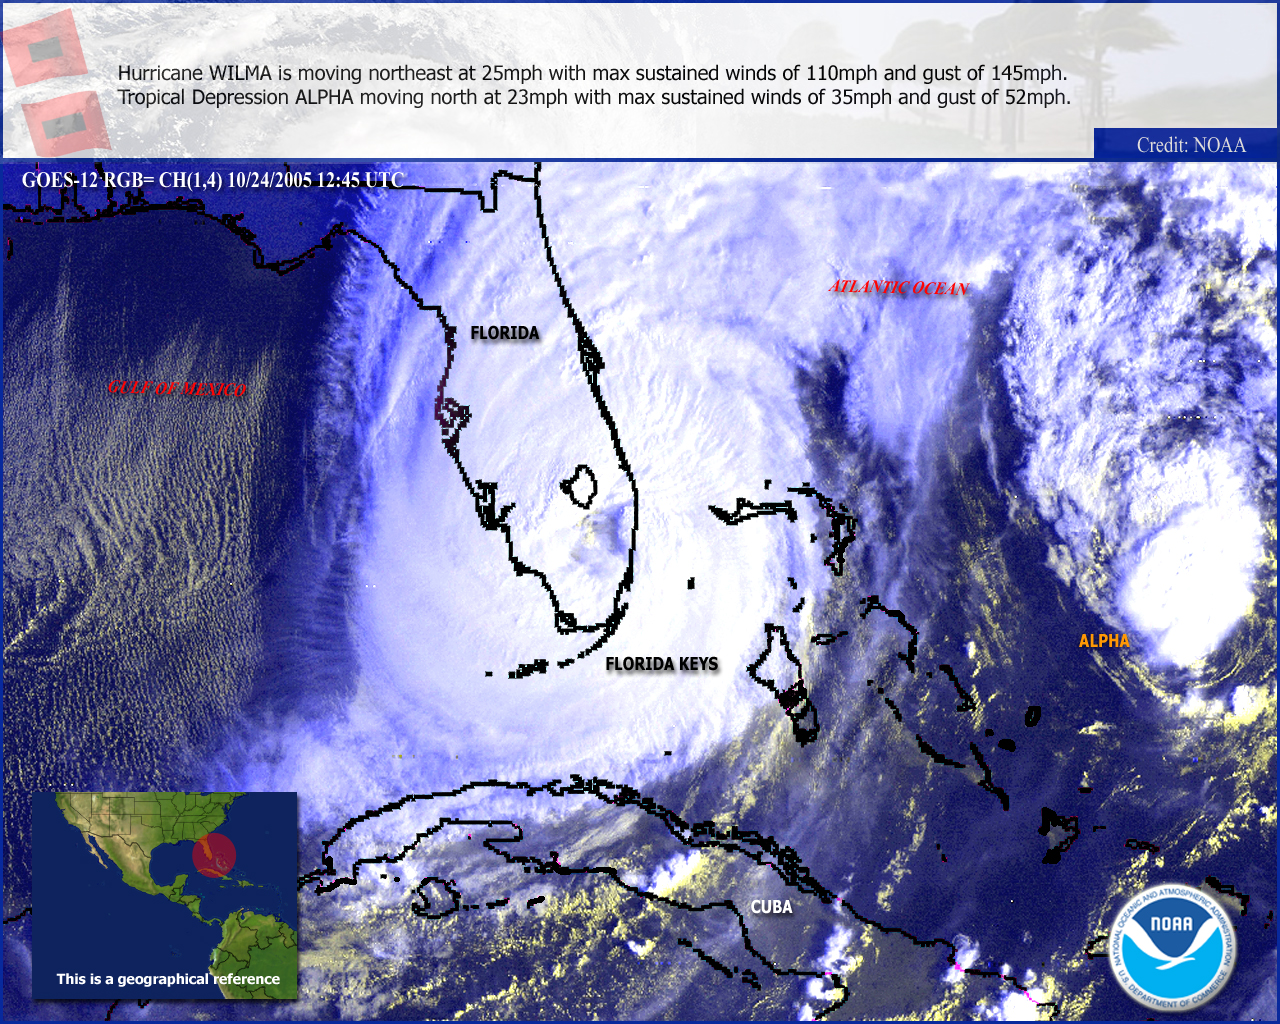
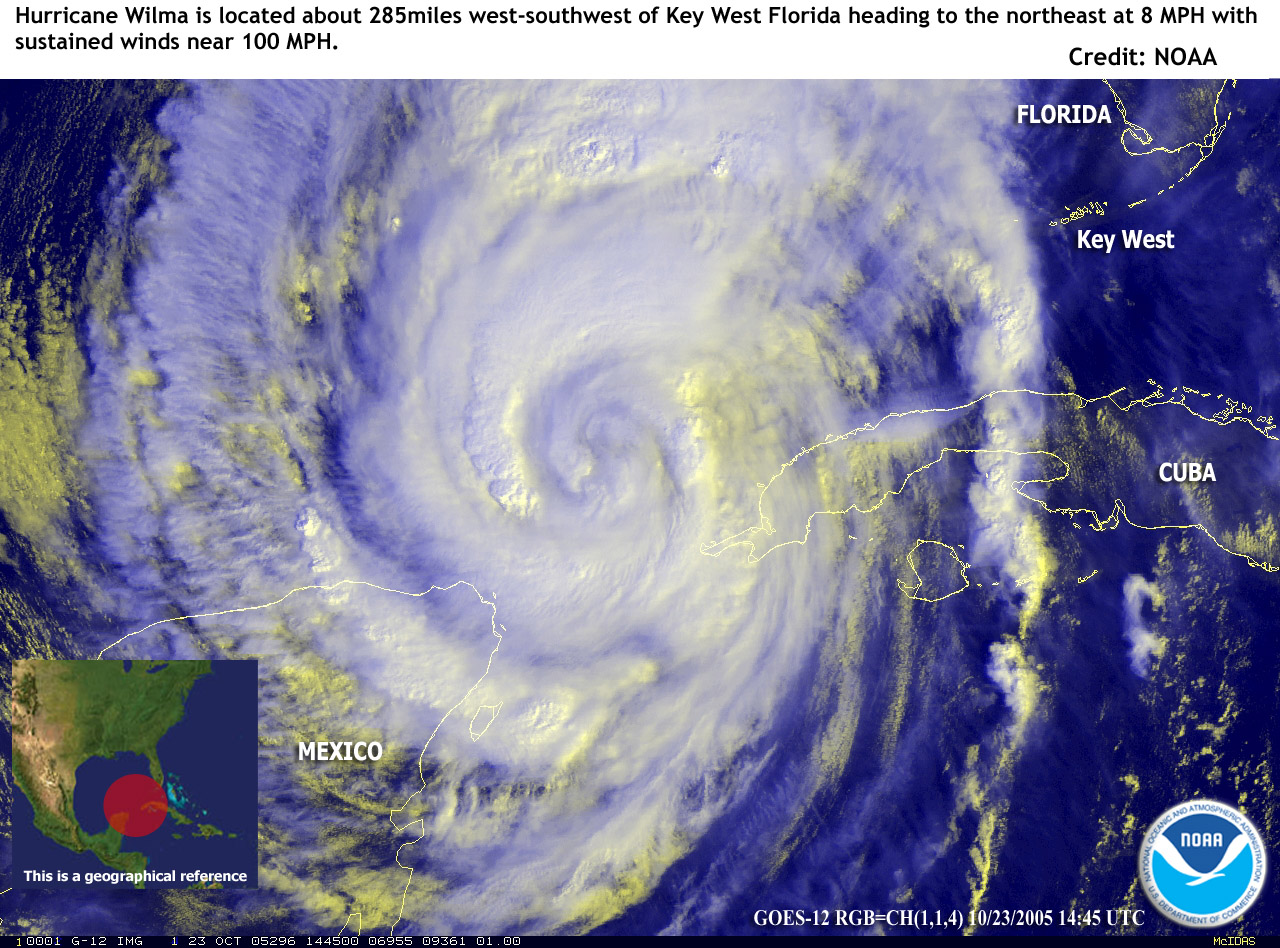
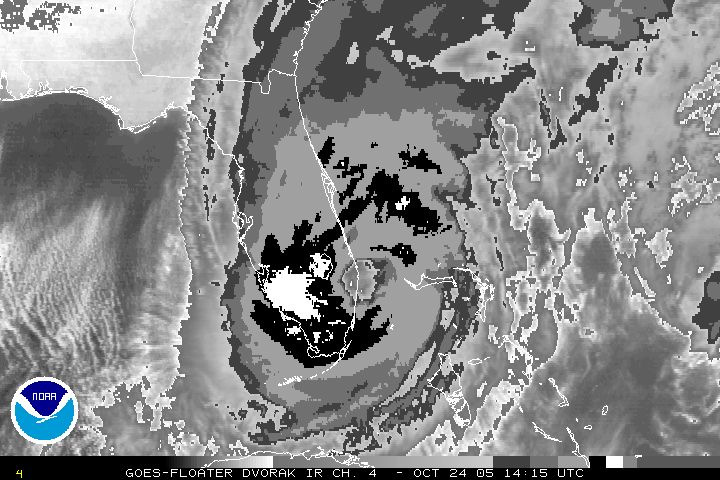
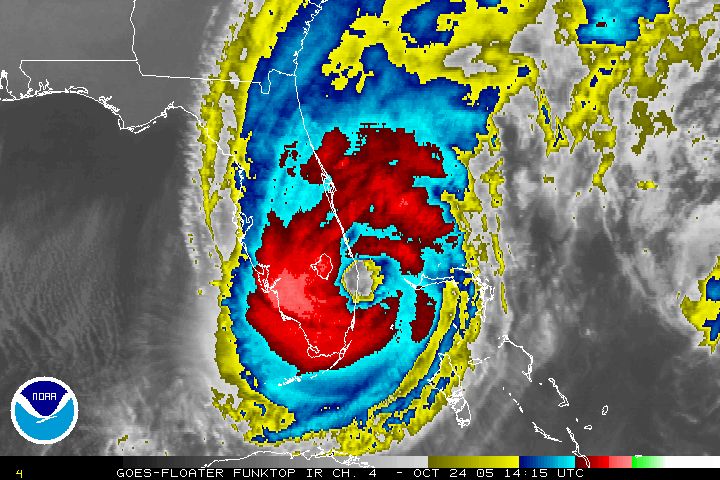
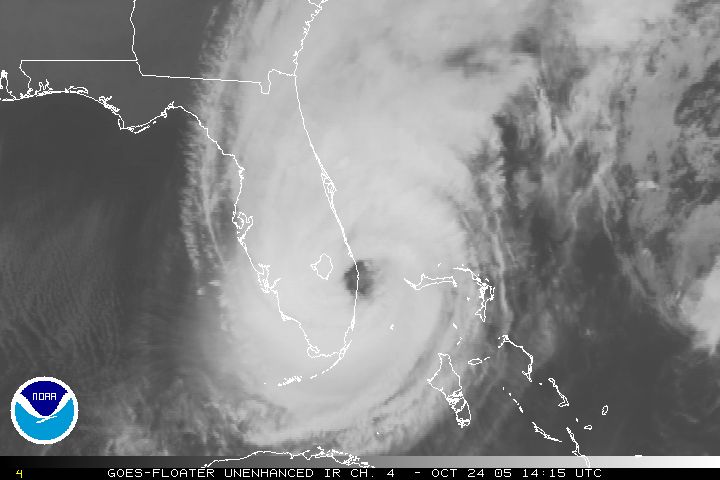
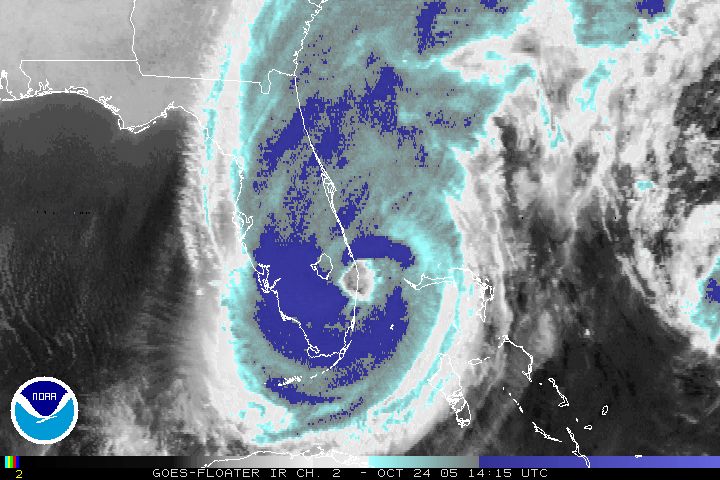
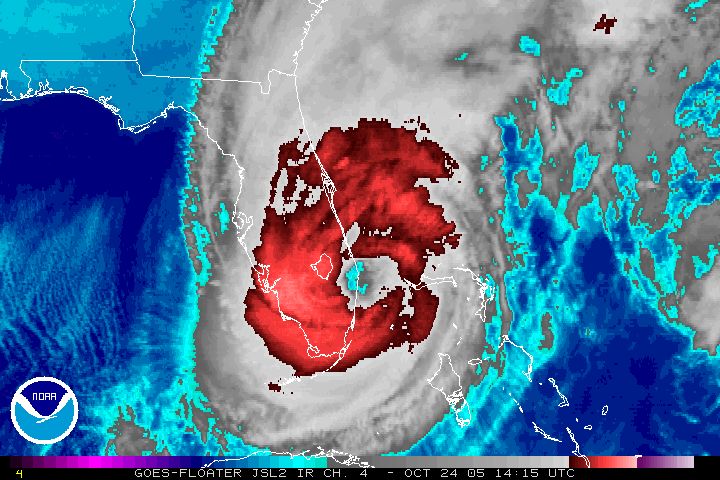
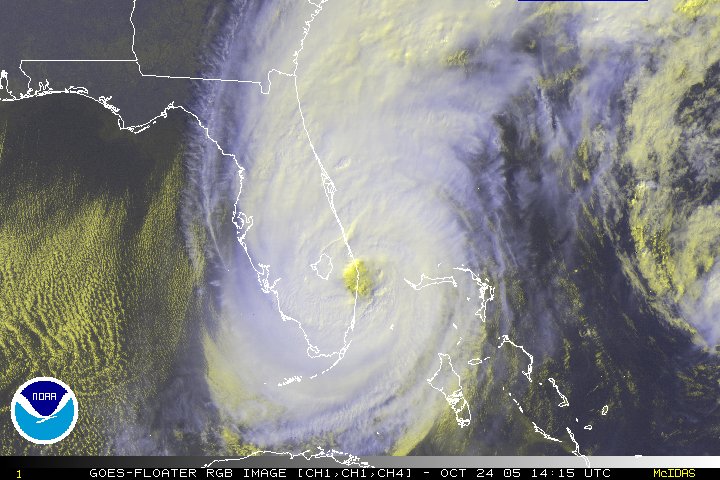
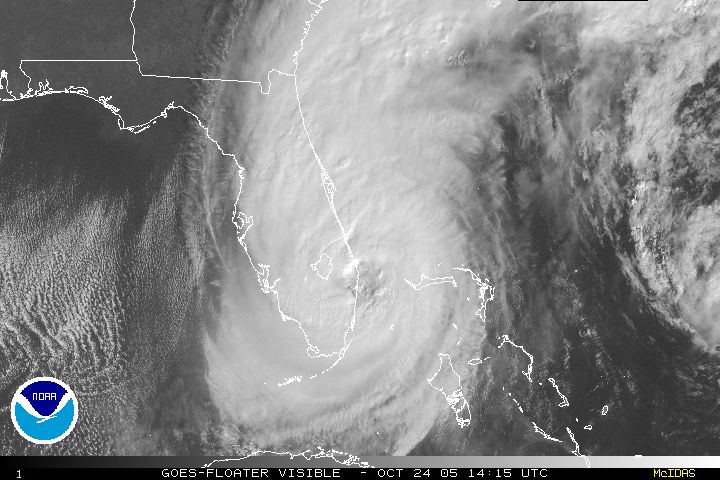
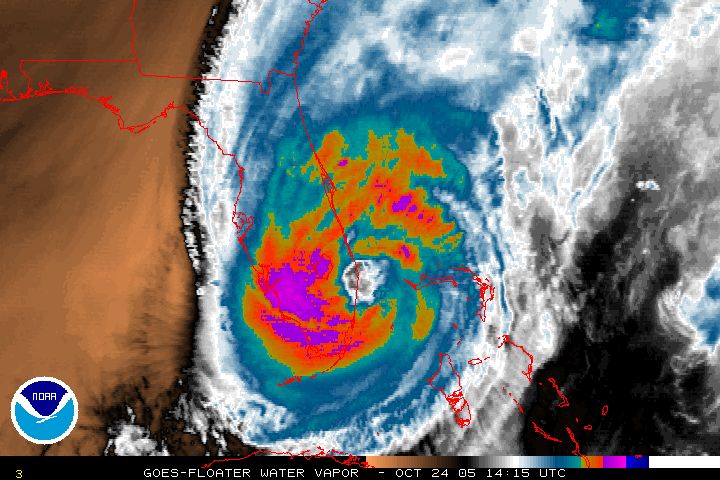
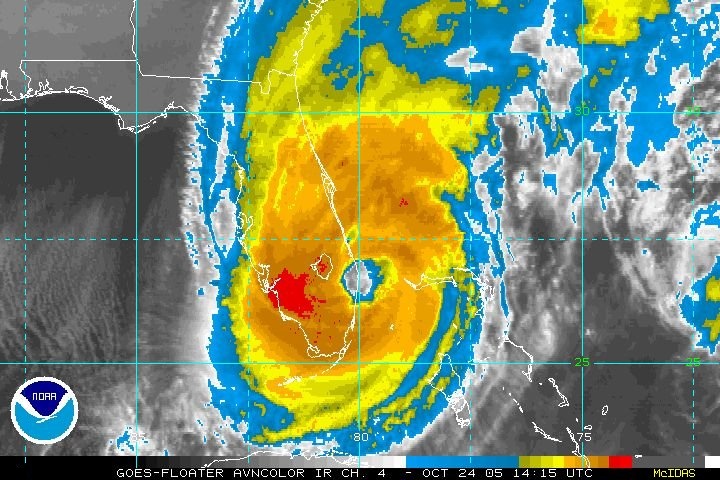
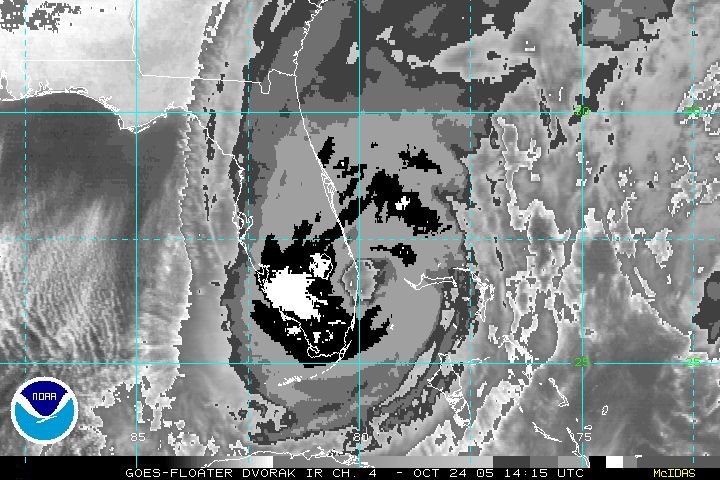
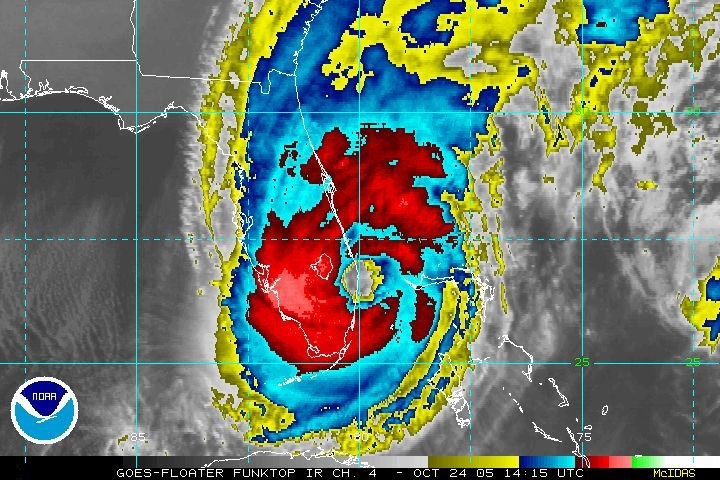
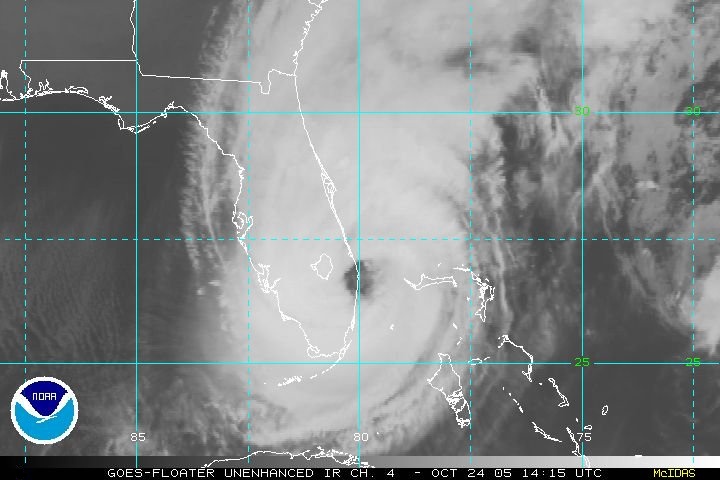
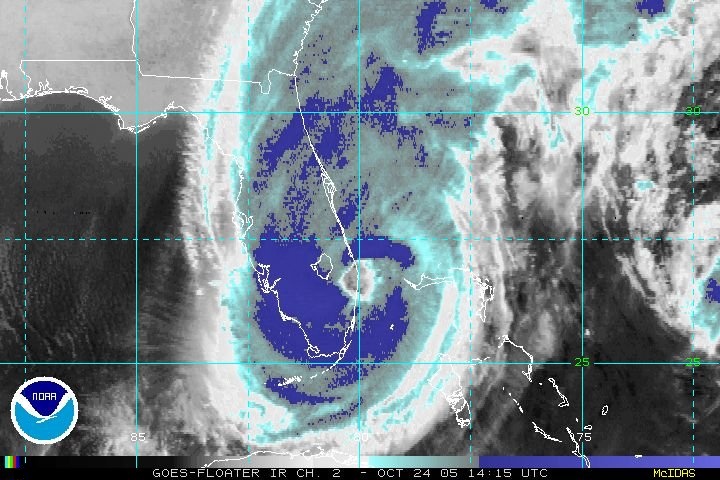
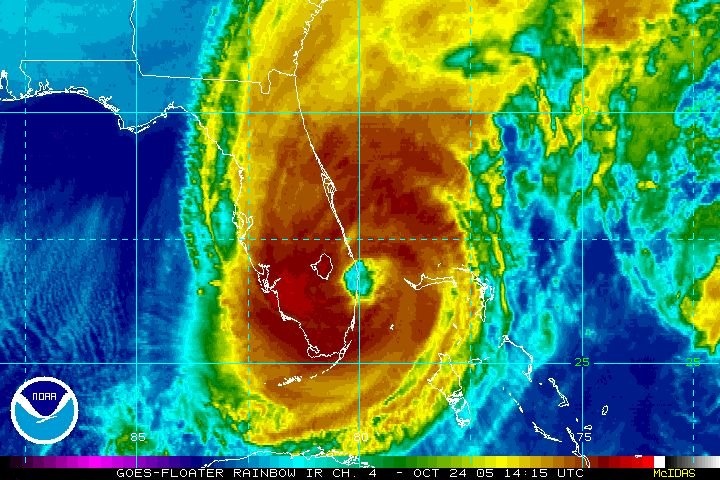
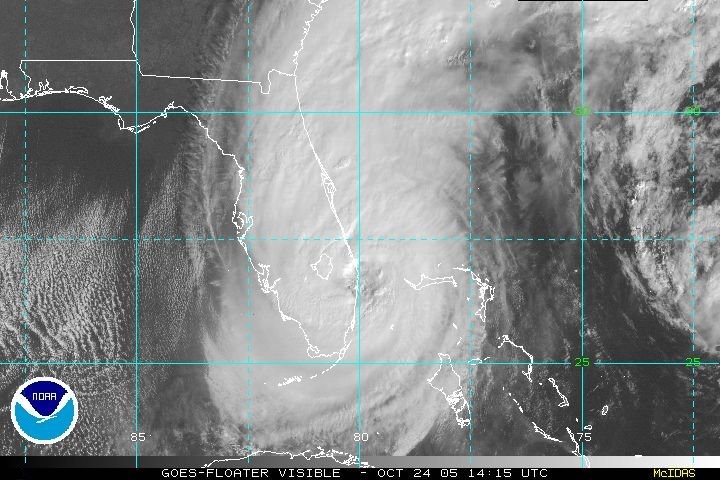
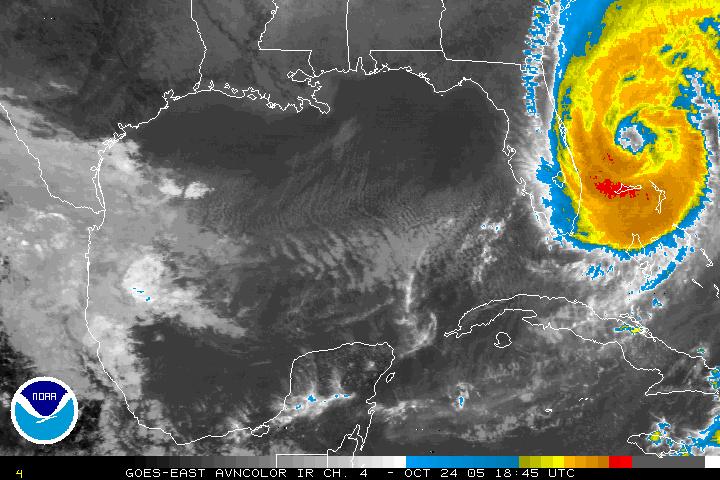
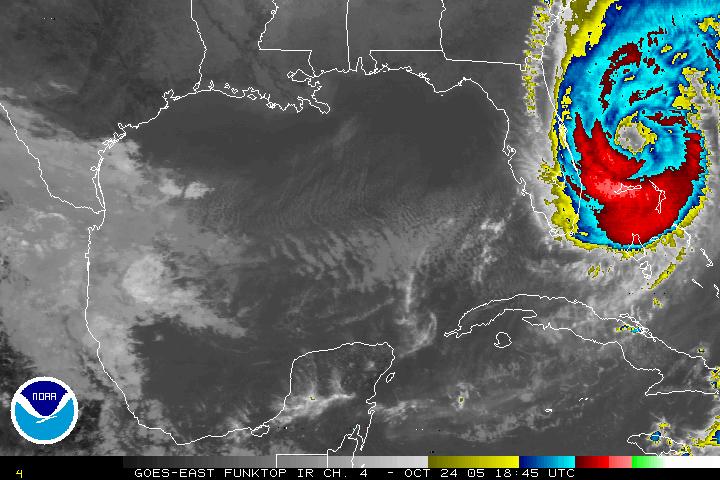
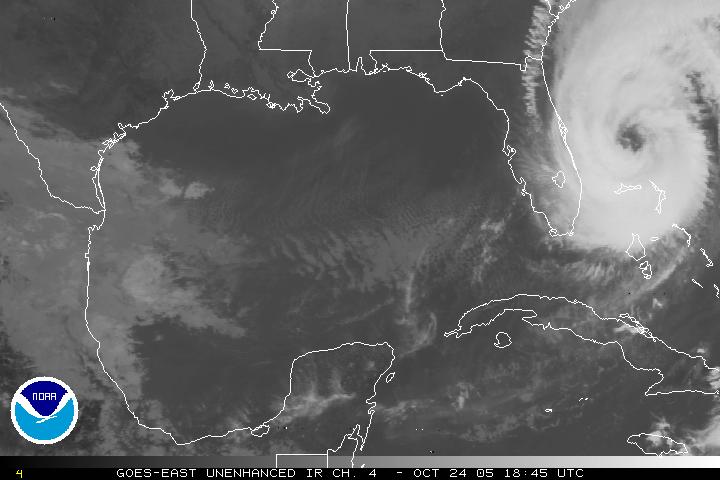
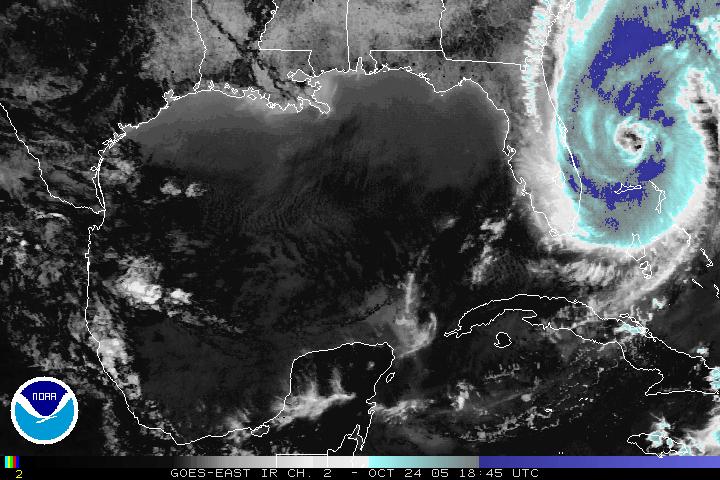
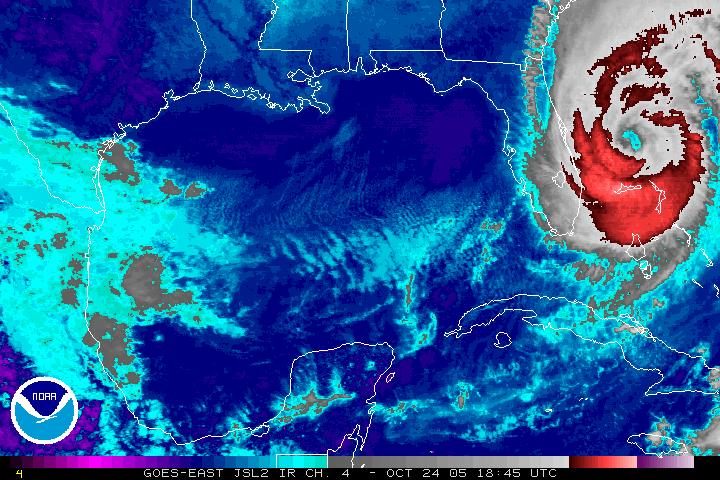
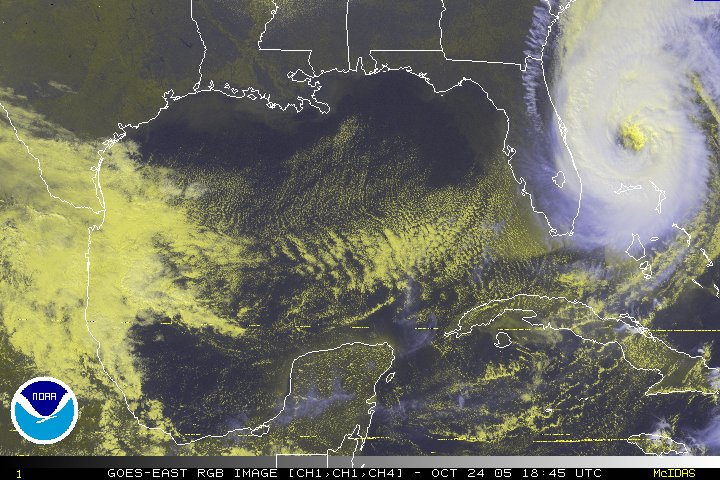
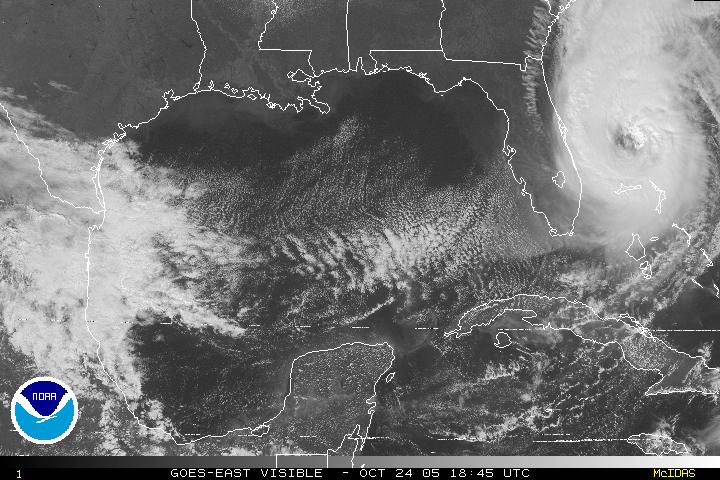
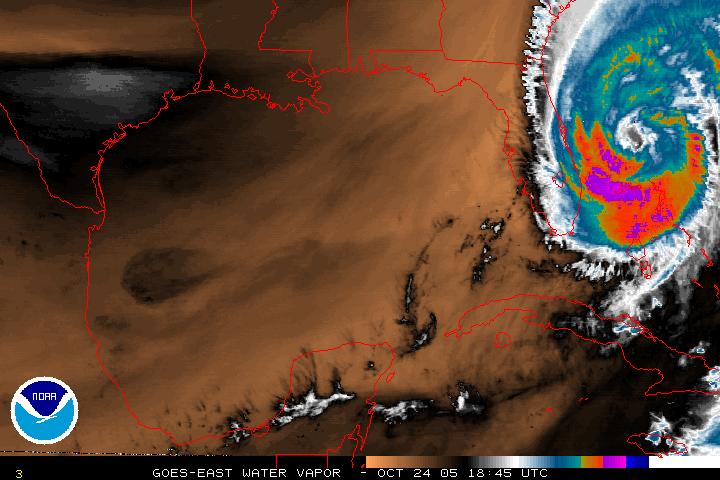
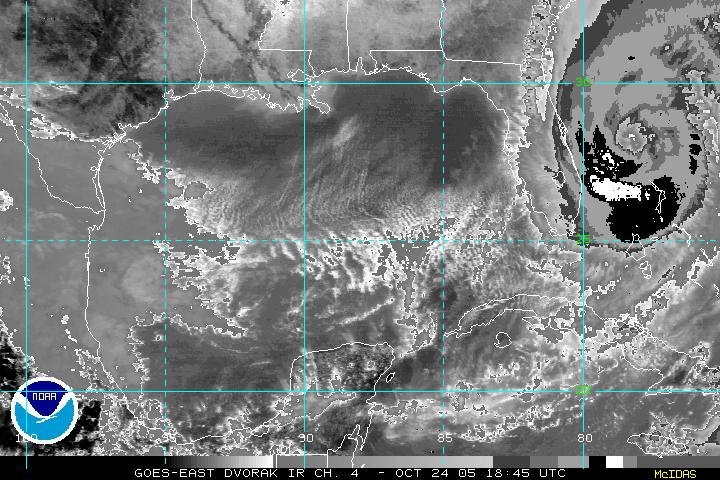
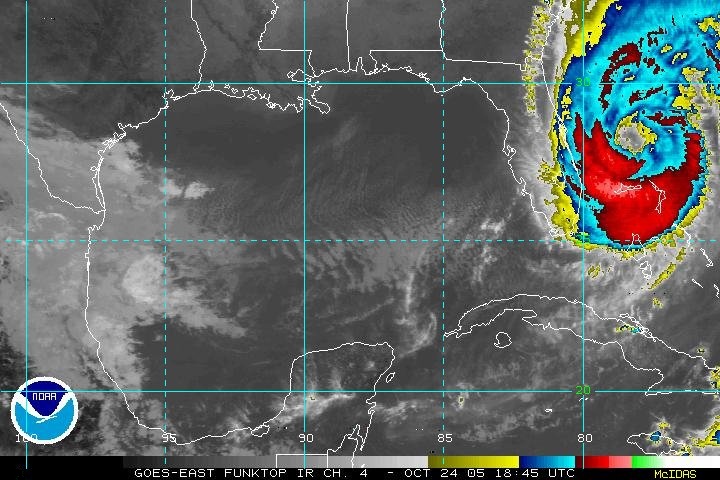
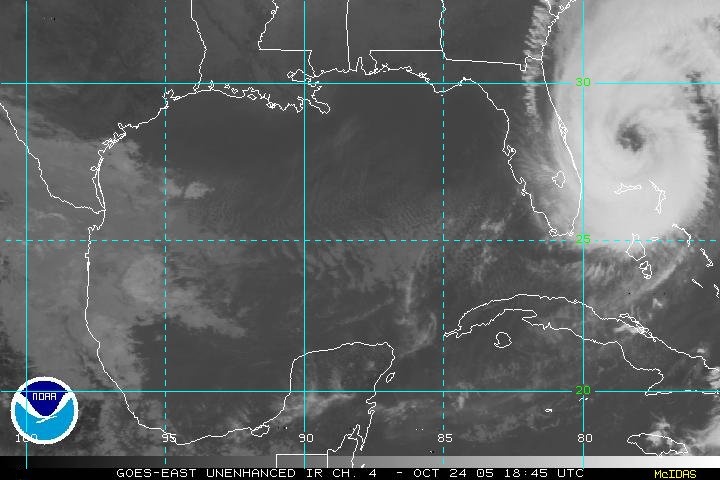
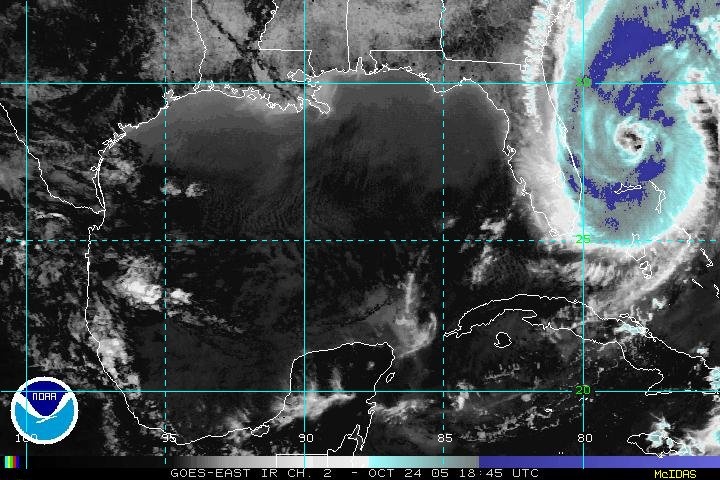
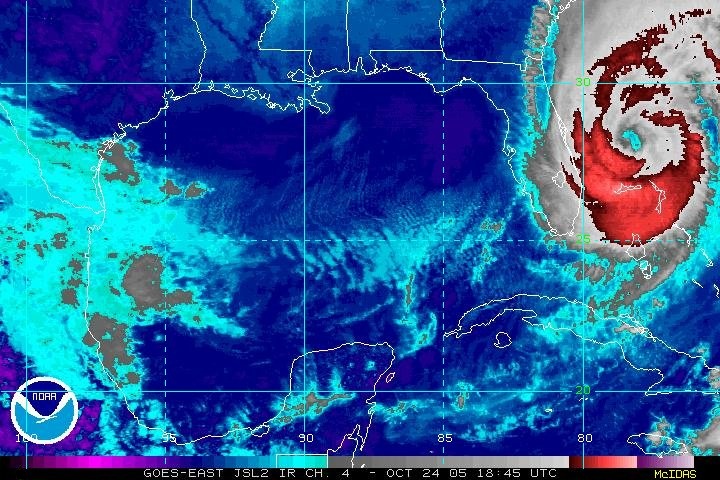
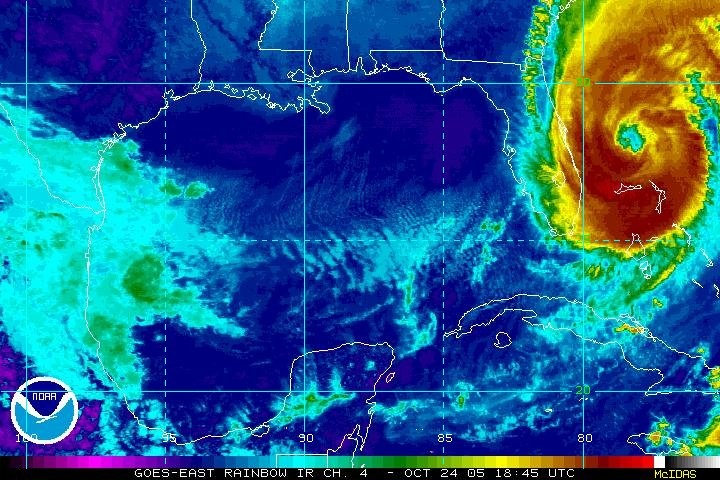
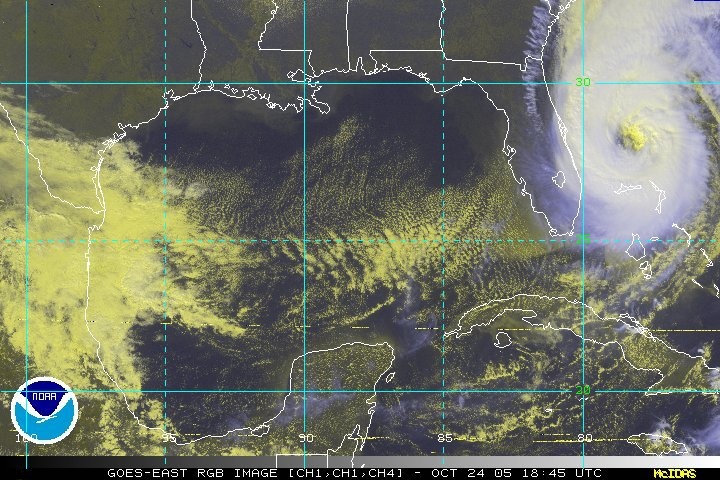
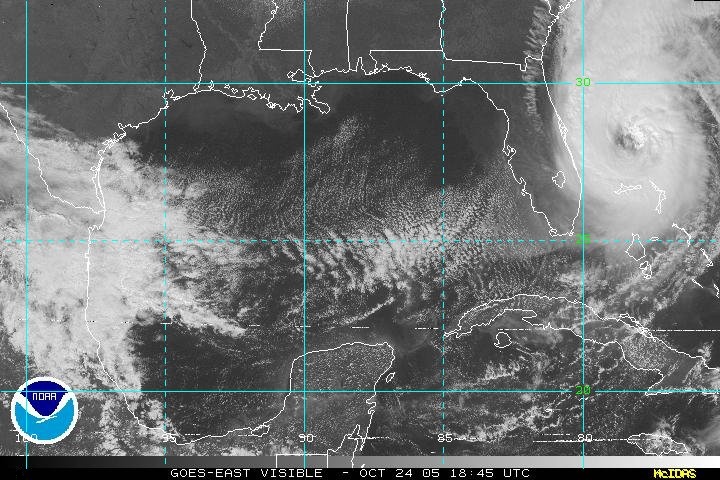
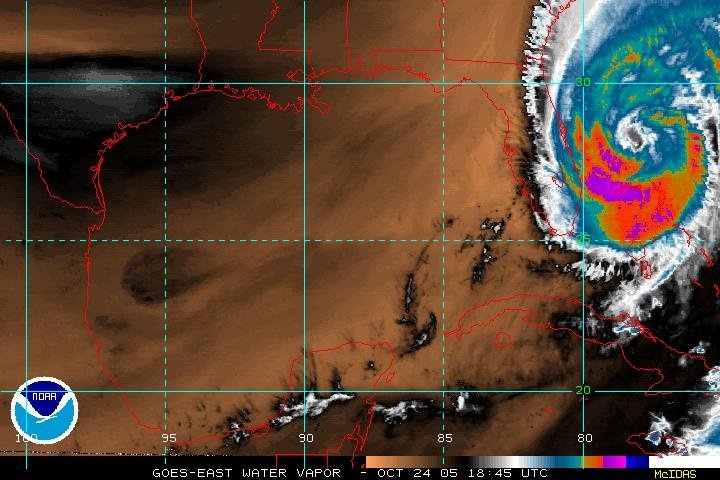
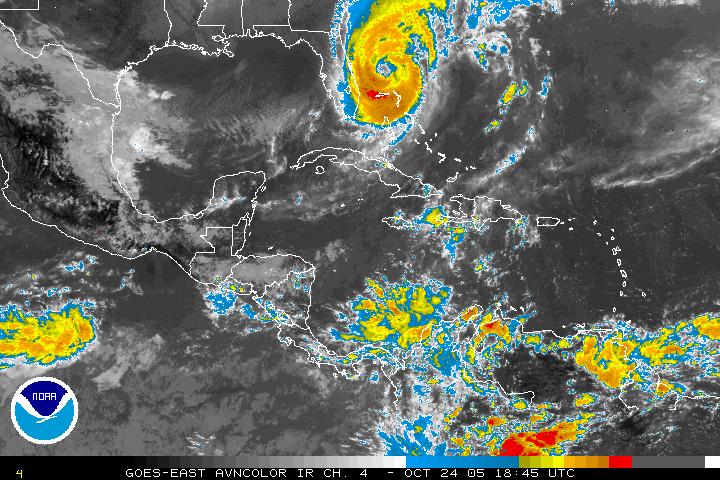
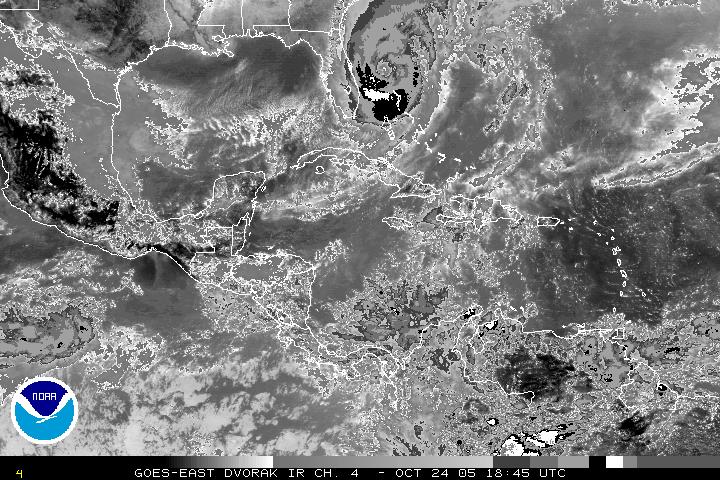
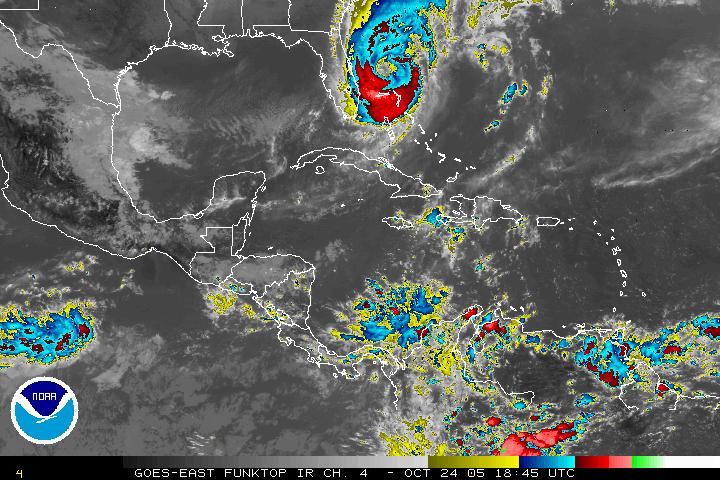
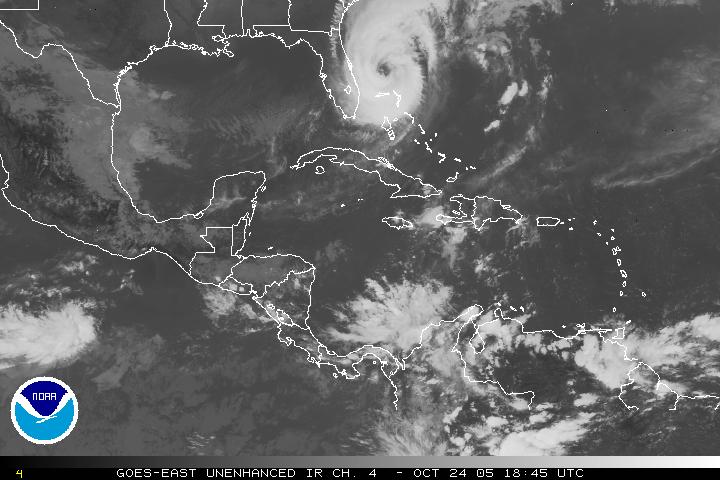
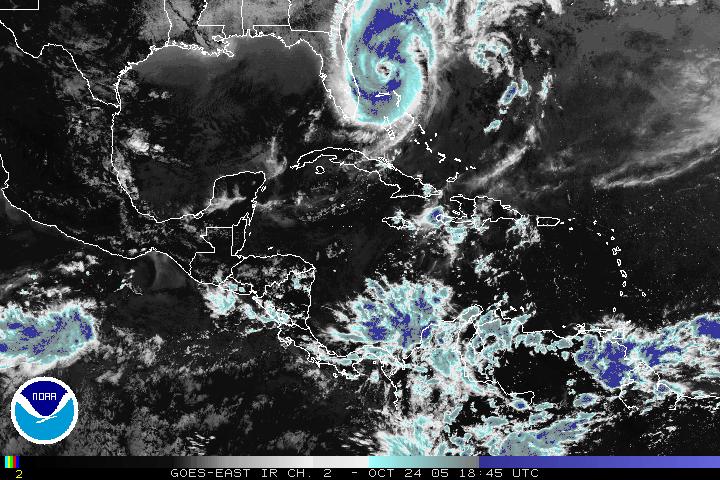
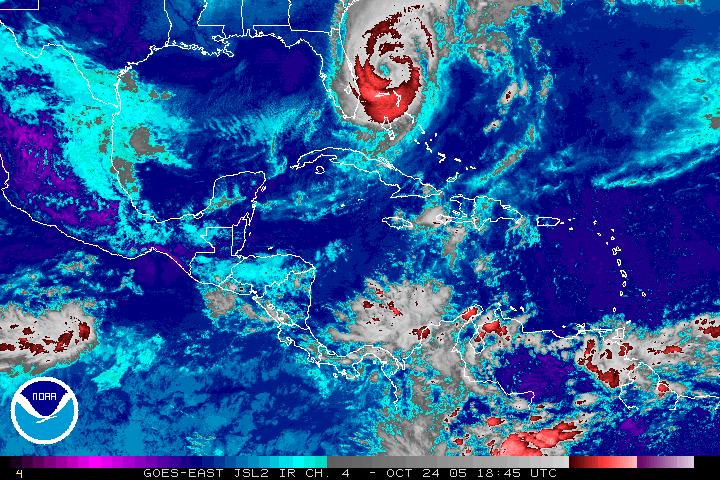
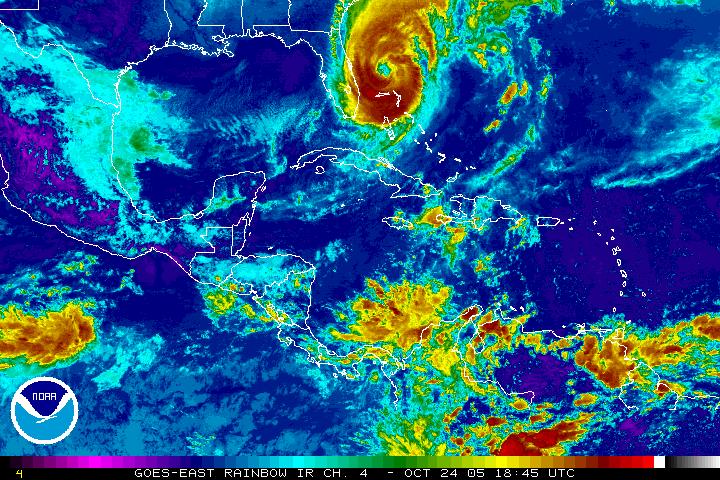
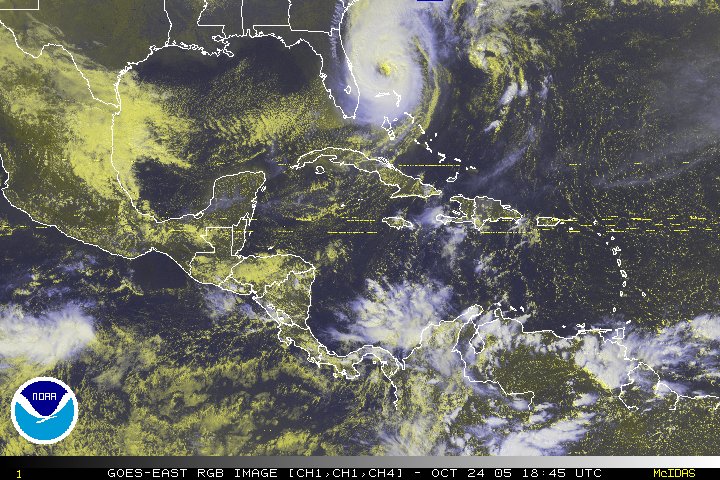
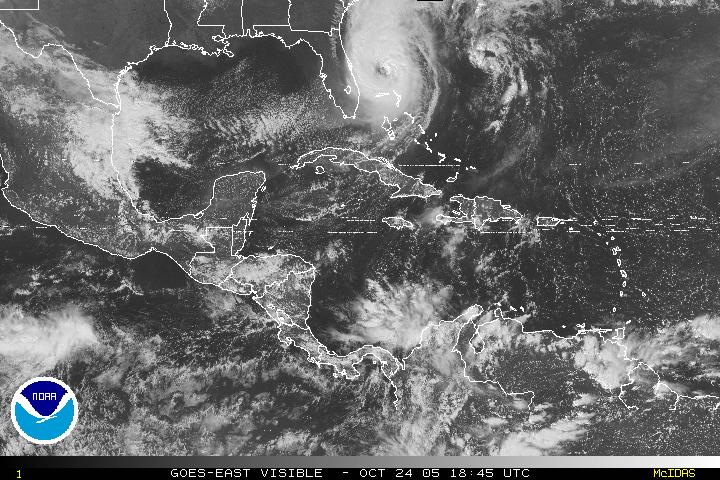
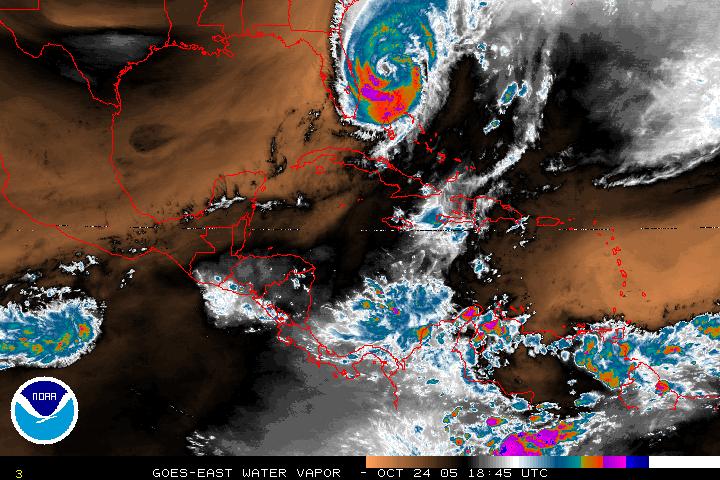
Hurricane Wilma, 14:15Z, October 24, 2005 – Just northeast of West Palm Beach Florida. Maximum sustained winds were near 105 MPH with higher gusts making Wilma a category two hurricane on the Saffir-Simpson scale. The eye was estimated at 55 Nautical Miles wide. Hurricane Wilma Operational Significant Event Images
National Hurricane Center Tropical Cyclone Report and Advisory Archive.
|
Floater Imagery Gulf Of Mexico Imagery Western Atlantic Imagery Downloadable AVI Files Tropical Rainfall Potential (TRaP) Rain Rate |